Introduction
It has been well known that the zeta potentials of fibrous substances present in various liquid phases are importantly related to their surface state or the adsorption of various substances to their surface.
From this point of view, many studies have been conducted on the relationship between the zeta potential of fibrous materials and moisture absorption, swelling, dyeing, washing, papermaking, etc., they have been interested as not only basic research but also the industrial application. Zeta potential measurement of fibrous materials1) has been performed for a long time, but measurement examples were mainly by the streaming potential method.
Currently, zeta potential measurement is mainly performed by electrophoresis, but it was said that electrophoresis is not suitable for measuring fibrous materials. This time, the method of measuring the surface zeta potential of flat plate-shaped and sheet-shaped samples has been expanded, and succeeded in measuring the surface zeta potential by electrophoresis with ease. This report introduces the principle of the zeta potential measurement method for the surface of a flat sample, the surface zeta potential measurement method developed by applying it for fibrous materials, and measurement examples.
271-297 Kyoritsu Shuppan
Principle of surface zeta potential measurement method for flat sample
The zeta potential on a flat surface or a sheet-shaped sample is indirectly measured from Mori and Okamoto's equation2) by using the electroosmotic flow in the liquid generated by the potential on sample surface.
(1) Electroosmotic flow
Generally, a quartz cell is used for the measurement cell, but the isoelectric point of quartz is pH 2 to 3, and the surface of the cell is usually negatively charged, so there are many positively charged ions in the solution near the inner wall of the cell. When a voltage is applied to the cell, the positive ions near the cell wall are attracted to the cathode side and move to generate a flow. Since the cell is usually a closed system, the flow near the cell wall will be refluxed, and a reverse flow will occur near the center of cell. This flow inside the cell is called an electroosmotic flow (Fig. 1).
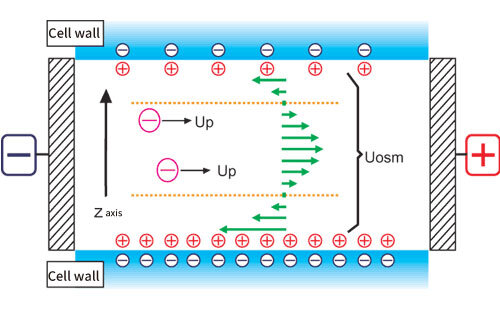 Figure 1. Conceptual diagram of electroosmotic flow
Fig. 2 shows a schematic diagram of the cell for measuring the surface zeta potential of a flat plate sample.
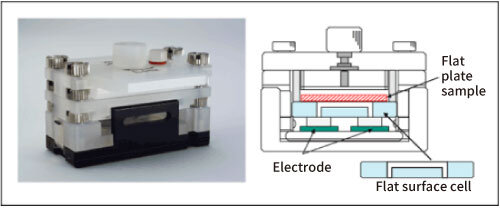 Figure 2. Flat surface cell
The structure is such that a flat plate-shaped or sheet-shaped sample is adhered to the lower surface of a box-shaped quartz cell, and a monitor particle suspension is injected inside the cell. As standard monitor particles, polystyrene latex (particle diameter of about 500 nm) is coated with hydroxypropyl cellulose to reduce the zeta potential to almost zero. Electrophoretic measurements of monitor particles are performed at each position in the cell depth direction. Since the zeta potential of the monitor particles is almost zero, the electroosmotic flow represents the flow generated by the charge state of the cell top surface and the flat plate sample. In addition, in order to reduce the vertical change in electroosmosis mobility and improve accuracy, the inner wall of the flat surface cell is coated with polyacrylamide to reduce the charge to almost zero.
(3) Mori-Okamoto’s equation
Several theoretical formulas with different boundary conditions have been reported for the analysis of electroosmotic flow 3-5). But here, in a rectangular parallelepiped cell, the following Mori and Okamoto equation, which is modeled when the flow velocities of the upper and lower surfaces are different is used.
Uobs(Z) = AU0(Z/b)2 +ΔU0(Z/b) + (1-A)U0 +Up
Uobs(Z):Apparent velocity measured at position y
Z:Distance from cell center
A=1/[(2/3)-(0.420166/k)]
k=a/b:Ratio of side lengths a and b of the cell cross section (a> b)
Up:True particle mobility
Uo:Average flow velocity of the solvent on the upper and lower surfaces of the cell
ΔUo:Difference in the flow velocity of the solvent on the upper and lower surfaces of the cell
Here, the position where Uobs = Up is called the stationary layer (stationary level), and the observed mobility is the true mobility of the particles. Therefore, when the cell depth is smaller than the cell width (k ≧ 5), after measuring the mobility at each cell position by moving up and down the measurement position, the true mobility of the particles(Up) is analyzed by approximating the data by the least squares method and comparing the coefficient. At the same time, the average flow velocity of the solvent on the upper and lower surfaces of the cell (U0) and the difference in the flow velocity of the solvent on the upper and lower surfaces of the cell (ΔU0) are calculated from this equation. So, the mobility at the upper and lower surfaces of cell can be calculated, and the surface zeta potential of flat plate sample placed on the upper surface can be estimated.
"L.Greatz,Ed.,Barth,Leipzig,1921
Surface of fibrous material and zeta potential
Fibers are usually divided into natural and synthetic fibers. When classified in terms of affinity for water, it is roughly divided into hydrophilic fibers and hydrophobic fibers. It is generally said that natural fibers belong to hydrophilic fibers and synthetic fibers belong to hydrophobic fibers. In addition, fibers can be classified into negative fibers with acidic groups and amphoteric fibers with both acidic and basic groups by distinguishing them from their charged states. Cotton is said to be a negative fiber because it is partially oxidized by bleaching or air oxidation and has a carboxyl group, and all of them show negative electric charge in water. Animal fibers such as wool and silk and synthetic fibers such as nylon are classified as amphoteric fibers and are known to have an isoelectric point because of their acidic and basic groups. Thus, it is very important to measure the zeta potential as differences in the structure or properties of the various fibers are reflected in the surface condition of the fibers in solution.
It is also closely related to fiber hygroscopicity, surface dyeing and cleaning. For example, acid dyes, azo or anthraquinone sulfonic acids or sodium salts of carboxylic acids dye amphoteric fibers well, but do not dye acid fiber cotton. Furthermore, when dyeing, a leveling agent, a dispersion leveling agent, a wet fastness enhancer, etc. are added in order to dye uniformly, with good fastness and reproducibility. Zeta potential of fibers is closely related to the quality of dyes and a lot of research have been done.
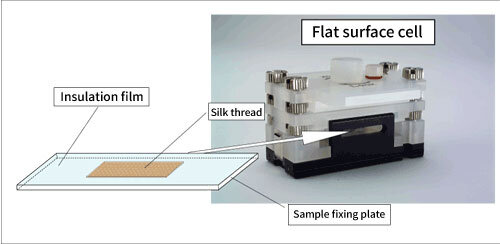 Figure 3. Conceptual diagram of surface zeta potential measurement of fibrous and filamentous samples
Measurement of surface zeta potential of fibrous material
It was very difficult to measure zeta potential of fibrous substances until now because the fibers themselves absorb water and water leakage occurs even if fibrous or filamentous substances are placed in a flat surface cell. However, it was found that if the fibrous material is surrounded by an insulating film as shown in Fig. 3, water leakage does not occur, and measurement can be performed easily. Using this sample fixation method, the surface zeta potential of a filamentous sample was attempted to measure.
(1)Measurement conditions
pH dependence of surface zeta potential of botanical fiber cotton and animal fiber silk threads were measured with the flat surface cell by changing pH of monitor particle solution from 2 to 6. As mentioned in the part 2, polystyrene latex, whose particle diameter is about 500 nm and which is coated with hydroxypropyl cellulose to reduce the zeta potential to almost zero, was used as standard monitor particles. They were dispersed in 10 mM NaCl solution so that they became slightly cloudy. 0.1 M to 1 M HCl was used to adjust the pH of the solution.
Electrophoretic mobility of the surface of the sample was obtained by measuring at 7 points inside the glass cell and analyzing electroosmotic flow with Mori-Okamoto’s equation. Surface zeta potential was calculated from obtained electrophoretic mobility with Smoluchowski's6) equation.
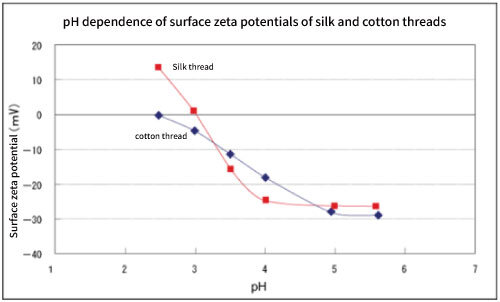 Figure 4. pH dependence of surface zeta potentials of silk and cotton threads.
(2) Measurement results and discussion
Fig. 4 shows the pH dependence of the surface zeta potentials of cotton and silk threads. Cotton threads have negative zeta potential at any pH and reached to the saturation near pH 6. And the pH corresponding to the half of saturated zeta potential is 3.5 to 4, which is almost the same as the pKa (pH 3 to 4) of carboxyl group.
Since cotton thread is a negative fiber and has an acidic group (carboxyl group), it seems that it has a pH dependence that reflects it. By utilizing this, it may be possible to qualitatively know the acidic dissociation groups of unknown negative fibers 7). On the other hand, the zeta potential of silk thread which is amphoteric fiber has a positive value on the acidic side, and the isoelectric point where the charge becomes zero shows near pH 3. This is a reasonable result because it has an acidic group (carboxyl group) and a basic group (amino group), and the isoelectric point (near pH 3) is in good agreement with the literature values 8).
64,573 (1961); Dyes and Chemicals, 8,543 (1963); Surface, 2,14 (1964)
Conclusion
It is said that the surface potential of fibrous materials was first measured in the early 1900's 9). Around 1930, research in this area was quite active, most of which were the flow potential method and the electroosmosis method. The zeta potential measurement method for the fiber surface by electrophoresis was introduced this time, but it is not new in terms of measuring the surface charge of the fiber. However, the method using the Mori-Okamoto's equation by electrophoresis is valuable in that not only the measurement of the surface zeta potential of the fiber but also the zeta potential of the monitored particles to be electrophoresed can be obtained at the same time. In the future, it is highly expected that it will be used for the development of colloidal dispersion such as detergents and fabric softeners for fibers and dyes.
9)Perrin, J .: J.Chem.Phys. ,3,50 (1905)
(Revised in September, 2022)